The Bridge Between Spectrum and Composition
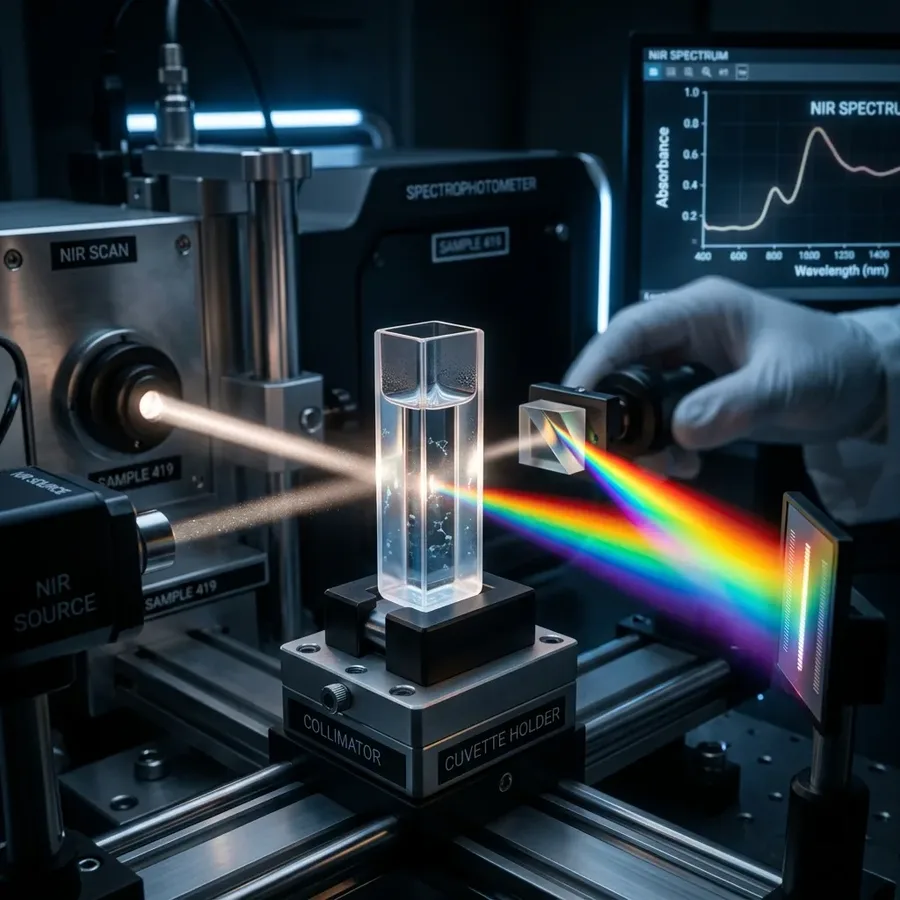
An FT-NIR spectrometer measures an absorption spectrum — how much infrared light is absorbed at each wavelength. The spectrum does not directly tell you the fat or protein content; it is a raw physical measurement. A chemometric calibration model — a mathematical function mapping spectral features to composition values — is required to extract composition from the spectrum.
“A calibration model is the mathematical bridge between what the spectrometer sees (light absorption) and what you need to know (composition values like protein, fat, or moisture).”
PLS Regression — The Industry Standard
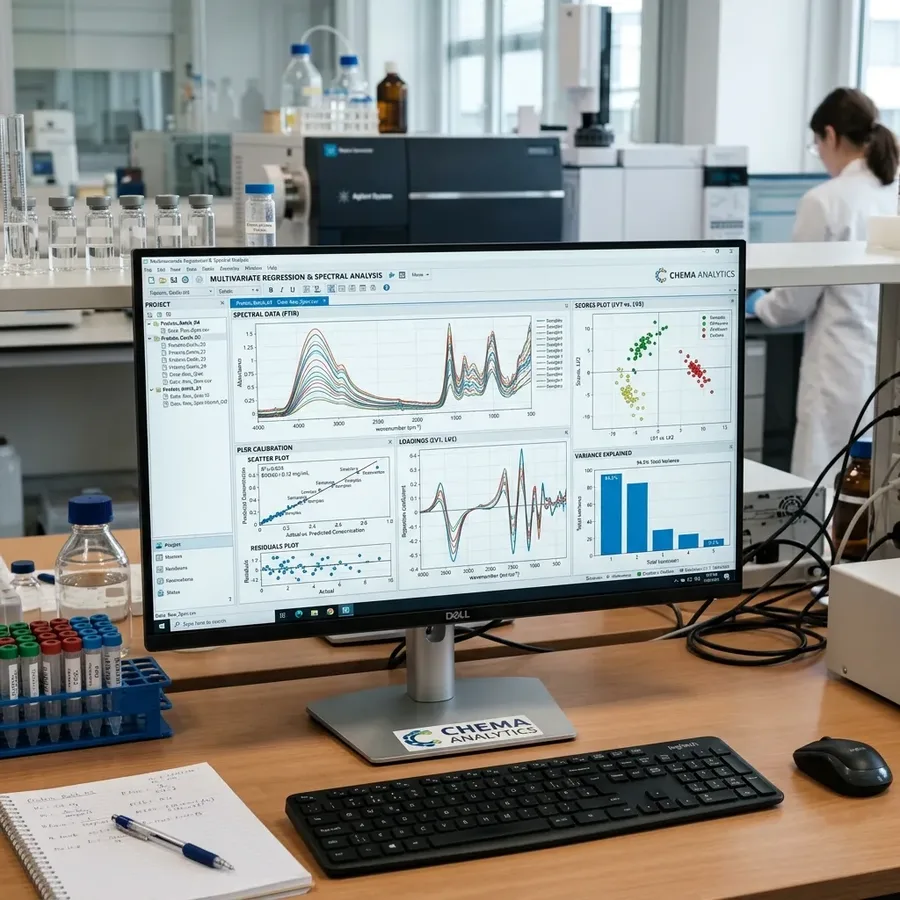
Partial Least Squares (PLS) regression is the most widely used chemometric method for NIR calibration. PLS finds linear combinations of spectral variables — latent variables — that explain maximum variance in both the spectral data and the reference composition values simultaneously.
Unlike simple linear regression, PLS handles the highly correlated nature of NIR spectral data and can model complex, overlapping absorption from multiple components at once. This is why it has become the gold standard in both food and feed, dairy, and chemical and pharmaceutical applications.
The Calibration Development Process
| Step | Description |
|---|---|
| 1 | Collect representative samples spanning the full composition range expected in production |
| 2 | Analyse each sample with validated reference method (Kjeldahl, Soxhlet, Karl Fischer, etc.) |
| 3 | Collect NIR spectra from same samples using the ProLine2550 |
| 4 | Build PLS model in caliX Spectral Suite chemometric software |
| 5 | Validate model on independent sample set — calculate RMSEP |
| 6 | Document validation for quality system or regulatory file |
What Makes a Good Calibration
- ✓ Representative sampling — covering all composition variation in your production
- ✓ High-quality reference data — accurate, precise, traceable to validated method
- ✓ Sufficient sample count — typically 80–200+ per matrix
- ✓ Good spectral diversity — different particle sizes, temperatures, moisture levels
- ✓ Independent validation set — never validate on calibration samples
- ✓ Target RMSEP: protein <0.12% (compound feed), fat <0.06% (whole milk)
“The quality of your calibration model is only as good as the quality of your reference data. Invest in accurate, traceable reference methods to build robust NIR predictions.”
For a step-by-step operational tutorial on building calibrations in practice, see our guide on PLS Regression in caliX Suite. Once your models are validated, ProChem deploys them for real-time inline measurement.