Why Spectral Range Is the Key Specification
When comparing NIR analysers, buyers often focus on accuracy figures from manufacturer literature. But accuracy is a product of two things: instrument quality AND calibration quality. The specification that fundamentally limits what a calibration can achieve — regardless of chemometrics sophistication — is spectral range. If the wavelengths where your target analyte absorbs are outside your instrument’s range, no modelling will recover that information.
“If the wavelengths where your target analyte absorbs are outside your instrument’s range, no amount of chemometric sophistication will recover that information.”
The NIR Spectral Landscape
| Spectral Region | Key Bonds | Instruments Covering |
|---|---|---|
| 700–1,100 nm (Short-wave NIR) | C–H overtones (weak) | Most instruments |
| 1,100–1,800 nm (NIR overtone) | C–H, O–H overtones (moderate) | Most instruments |
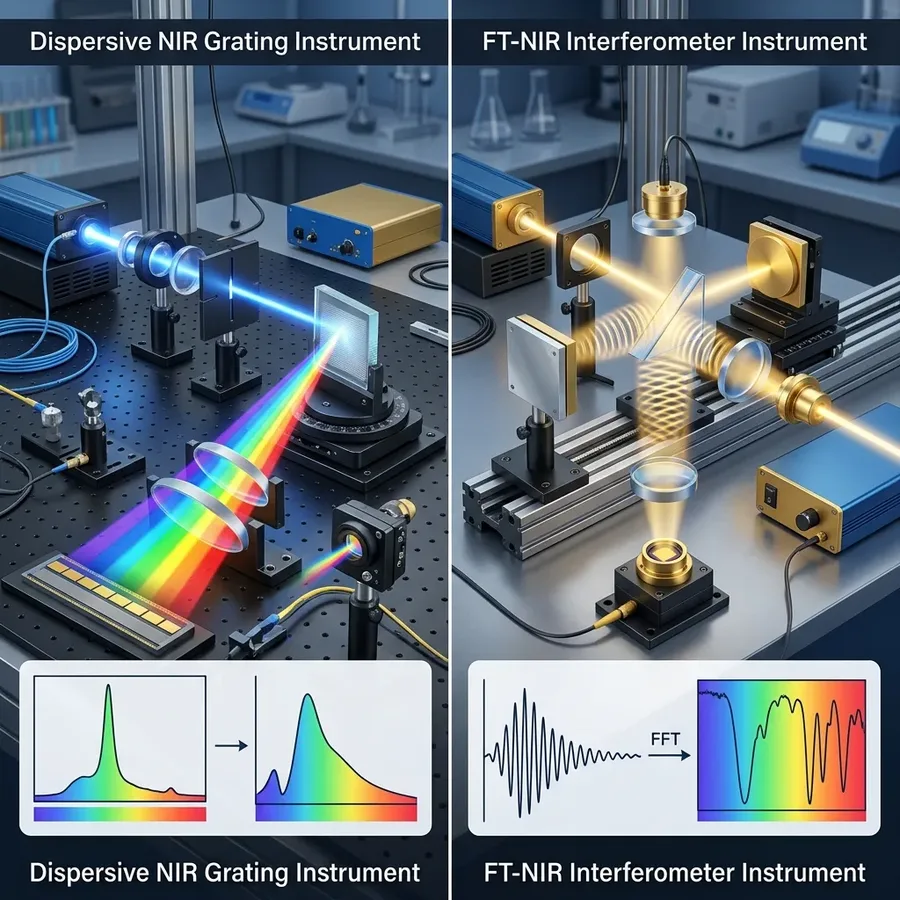
| 1,800–2,100 nm (Combination) | N–H, C–H combination (strong) | FT-NIR only (incl. ProLine2550) |
| 2,100–2,500 nm (Combination) | C–O, C–H starch, fibre (strong) | FT-NIR only (incl. ProLine2550) |
What 1,350–2,550 nm Coverage Delivers
- ✓ Full N–H combination bands (2,050–2,180 nm) — critical for protein accuracy on variable matrices
- ✓ Starch C–O combination bands (2,100–2,200 nm) — superior starch prediction
- ✓ Cellulosic fibre bands (2,270–2,350 nm) — completely missed by instruments stopping at 1,700 nm
- ✓ Higher selectivity fat analysis in 2,300–2,450 nm combination region
- ✓ More PLS spectral variables = more robust models on complex matrices
“The 2,000–2,500 nm combination band region contains the most analytically powerful absorption features for protein, starch, and fibre — and only FT-NIR instruments can access it.”
Build robust calibration models with caliX Spectral Suite and explore advanced wavelength selection techniques to maximize the potential of this extended spectral range.