If you work in food, feed, dairy, or agricultural processing, you have almost certainly encountered the term NIR — or its more advanced counterpart, FT-NIR. These technologies are increasingly referenced in quality control discussions, equipment specifications, and industry publications. But what exactly is FT-NIR spectroscopy, and why does it matter for your production operation? This guide cuts through the technical complexity and explains FT-NIR in terms that are useful whether you are an analytical chemist, a plant manager, or a procurement decision-maker.
The Basic Principle: Light as an Analytical Tool
Near-infrared spectroscopy is based on a simple physical principle: different chemical compounds absorb light at different, characteristic wavelengths in the near-infrared region of the electromagnetic spectrum (roughly 700 to 2500 nanometers). When you shine near-infrared light at a sample, the way that sample absorbs and reflects the light creates a unique spectral fingerprint. By analyzing that fingerprint, you can identify and quantify the chemical composition of a sample — its moisture content, protein level, fat percentage, starch concentration, and many other parameters — without any sample preparation, without reagents, and without destroying the sample in the process.
“NIR spectroscopy is sometimes described as a non-destructive analytical technique. The sample is not altered or consumed by the measurement — making it ideal for continuous, inline quality monitoring.”
What Makes FT-NIR Different from Standard NIR?
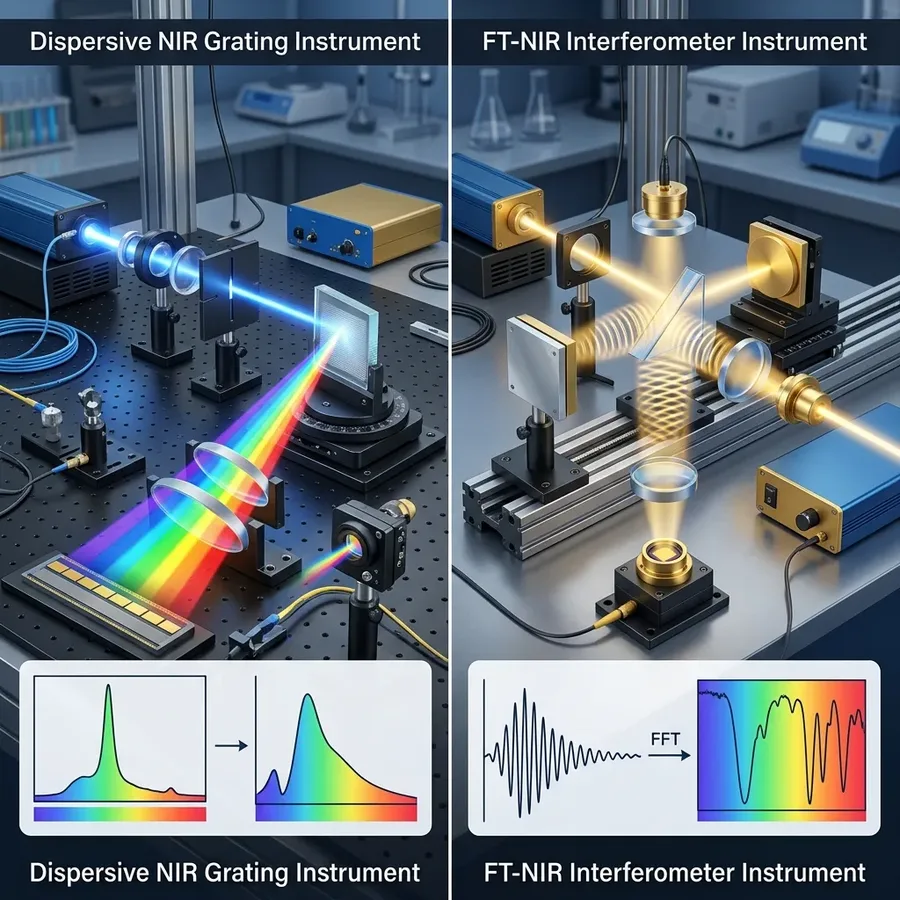
Standard dispersive NIR instruments use a physical grating or filter to separate different wavelengths of light before measuring them — similar to how a prism separates white light into a rainbow. FT-NIR takes a fundamentally different approach.
FT-NIR stands for Fourier Transform Near-Infrared. Instead of measuring individual wavelengths sequentially, an FT-NIR instrument uses an interferometer to collect data from all wavelengths simultaneously. The resulting signal is then processed using a mathematical algorithm called a Fourier Transform to extract the full spectrum.
The practical result: FT-NIR delivers higher spectral resolution, better signal-to-noise ratio, greater wavelength reproducibility, and more consistent measurement accuracy compared to standard dispersive NIR systems. These advantages become especially significant when you need to measure multiple parameters simultaneously or when sample variability is high.
From the Lab to the Production Line
Historically, NIR spectroscopy was a laboratory technique. Samples were collected from the production line, transported to the lab, and analyzed using benchtop instruments. Results were then reported back to the production team — typically with a delay of anywhere from 30 minutes to several hours.
Modern FT-NIR technology has changed this model fundamentally. Instruments like the ProLine2550 are designed for direct integration into production lines — measuring materials continuously and in real time, as they flow through pipes, chutes, or conveyors. The delay between production and analytical feedback is reduced from hours to seconds.
This shift from lab-based to inline analysis is not just a matter of speed. It enables a completely different approach to quality control: instead of testing finished product to determine whether it meets specification, you can monitor and control the process in real time to ensure it consistently produces product that meets specification.
What Can FT-NIR Actually Measure?
The range of measurable parameters depends on the calibration models developed for a specific instrument and application, but in food, feed, dairy, and agricultural contexts, FT-NIR is routinely used to measure:
- Moisture and water content
- Protein and amino acid profiles
- Fat and oil content
- Starch and carbohydrate levels
- Fiber content
- Lactose concentration
- Ash content
- Active ingredient concentration in formulated products
Multiple parameters can typically be measured simultaneously in a single scan — a significant efficiency advantage over methods that require separate tests for each parameter.
The Role of Calibration
One important aspect of FT-NIR analysis is calibration. The instrument does not inherently “know” what a given spectral fingerprint means — it needs to be trained using reference samples with known compositions. This training process is called building a calibration model.
Modern FT-NIR instruments come with pre-built calibration models for common applications, and these models can be refined or expanded to match specific raw materials, product formulations, or process conditions. Tools like the caliX Spectral Suite make it straightforward to build, manage, and deploy calibration models across instruments. Well-maintained calibration is central to maintaining measurement accuracy over time.
Why It Matters for Your Operation
The business case for FT-NIR inline analysis ultimately comes down to three things: speed, consistency, and cost. Real-time measurement enables faster process adjustments, fewer out-of-specification batches, reduced rework, and more consistent product quality. For manufacturers operating at scale, these improvements translate directly into measurable financial returns.
As regulatory requirements around traceability, nutritional labeling, and process documentation continue to tighten across food, feed, and pharmaceutical sectors, the ability to generate continuous, timestamped quality data also carries increasing compliance value. Software platforms such as ProChem enable centralized data management and reporting to support these requirements.
“Want to see FT-NIR in action on your production line? Contact USTECH to request a ProLine2550 demonstration.”